


Plants around the globe produce a wide variety of specialized metabolites that play key roles in communication and defense. Recently, evidence has been accumulating that (like in microbes) the genes encoding the biosynthetic pathways towards these metabolites are often densely clustered in specific genomic loci: biosynthetic gene clusters (BGCs). This offers great potential for genome-based discovery of plant natural products.
Here, we introduce plantiSMASH, a versatile online analysis platform that automates the identification of candidate plant BGCs, as well as their comparative genomic and transcriptomic analysis. The cluster detection logic, validated on a set of all plant BGCs that have been experimentally characterized thus far, is able to pinpoint many complex metabolic loci across the Plant Kingdom. Additionally, interactively visualized coexpression analysis and comparative cluster-cluster alignment allow users to judge multiple sources of evidence for a candidate BGC to encode a group of enzymes that truly functions jointly in a biosynthetic pathway. Furthermore, plantiSMASH finds coexpression correlations between candidate BGCs and genes elsewhere in the genome.
Altogether, this new software provides a comprehensive toolkit for plant geneticists to further explore the nature of gene clustering in plant metabolism. Moreover, spurred by the continuing decrease in costs of plant genome sequencing and assembly, it will soon allow natural product chemists to apply genome mining technologies to the discovery of novel medicinal compounds from a wide range of plant species.
The ideal input for plantiSMASH is an annotated nucleotide file in Genbank format or EMBL format. You can either upload a GenBank/EMBL file manually, or simply enter the GenBank/RefSeq accession number of your sequence for plantiSMASH to upload it. Alternatively, you can provide a FASTA file containing one or more sequences. If possible, you should also supply a separate GFF3-formatted file containing the annotation information for all said sequences. If no annotation is available, we recommend running your sequence through an annotation pipeline like MAKER (preferably with transcriptomic evidence) to obtain GBK/EMBL files with high-quality annotations. Otherwise, plantiSMASH will generate a preliminary annotation using GlimmerHMM, and use that to run the rest of the analysis.
Input files should be properly formatted. If you are creating your GBK/EMBL/FASTA file manually, be sure to do so in a plain text editor like Notepad or Emacs, and saving your files as "All files (*.*)", ending with the correct extension (for example ".fasta", ".gbk", or ".embl").
There are several optional analyses that may or may not be run on your sequence. Highly recommended is the ClusterBlast Comparative Analysis, which runs Diamond using each amino acid sequence from a detected gene cluster as a query on a large database of predicted protein sequences from secondary metabolite biosynthetic gene clusters, and pools the results to identify the gene clusters that are most homologous to the gene cluster that was detected in your query nucleotide sequence.
Also available is the analysis of gene coexpression from transcriptomics data. You can supply one or more additional file(s) either in GEO compliant *.soft format or in a simple CSV format (see CoExpress CSV file format); plantiSMASH will then generate several powerful visualizations to help you see how genes interacts in terms of expression in a set conditions, both within and between clusters.
The output of the plantiSMASH analysis pipeline is organized in an interactive HTML page with SVG graphics, and different parts of the analysis are displayed in different panels for every gene cluster (see example output file on the Arabidopsis thaliana, or other species in our precalculated results page).

Initially, a list of identified clusters is displayed in the results page.
A gene cluster can be selected for viewing by clicking its number (gene clusters are numbered in the order in which they appear on the input nucleotide sequence) in the "Select Gene Cluster" panel just below the top banner or by clicking on the colored "Cluster XX" boxes.
A click on "Overview" brings you back to the overview list.
Gene cluster buttons are color-coded by predicted secondary metabolite type.
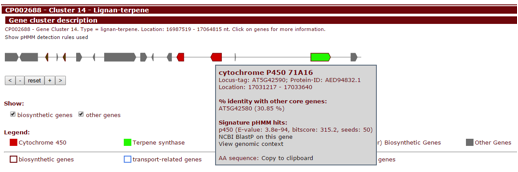
In the upper panel, "Gene cluster description", information is given about each gene cluster that was detected. In the upper line, the biosynthetic type and location of the gene cluster are displayed. Underneath this title line, all genes present in a detected gene cluster are outlined.
Genes are color-coded by their assigned enzymatic protein domain profile, which will be listed in the legend. Additionally, genes will also be categorized by its predicted function, which will be displayed as different color borders.
Hovering over a gene with the mouse will prompt the gene name to be displayed above the gene. Clicking the gene will provide more information on the gene: its annotation, its sequence similarity with other genes in the cluster, its location, and cross-links specific to that gene.
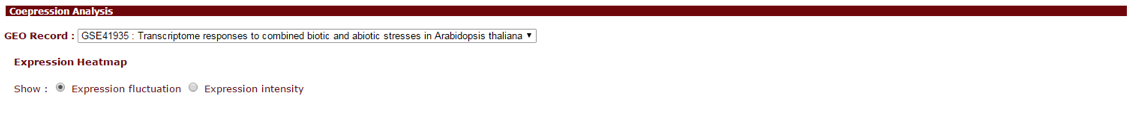
If coexpression data was provided (through either a .soft or .csv file), this panel will show expression information through both a hierarchically clustered heatmap and a coexpression network (see below).

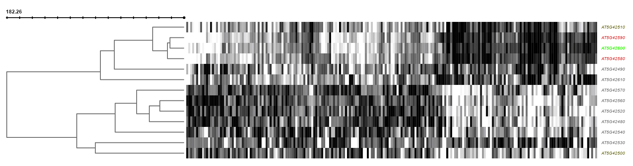
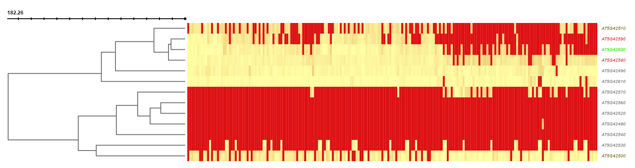
You can choose to show either expression fluctuation (the rate of which expression level of a gene changes between samples), color-coded from white to black; or expression intensity (expression level of a gene related to the sample value distribution), color coded from yellow to red.
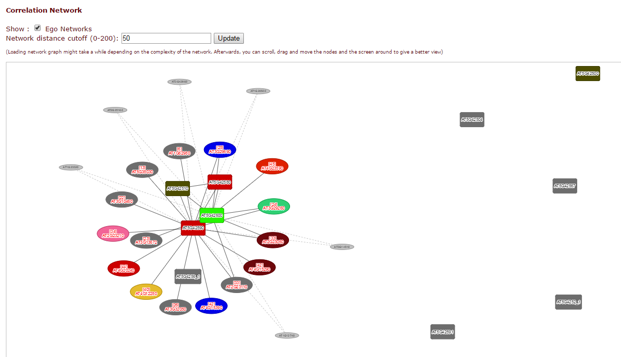
In the correlation network graph, you can see how genes within the cluster (box-shaped nodes) interact with each other, and with other genes in other clusters (ellipse-shaped nodes with solid edges and the corresponding cluster number inside) or anywhere else on the genome (ellipse-shaped nodes with dashed edges).
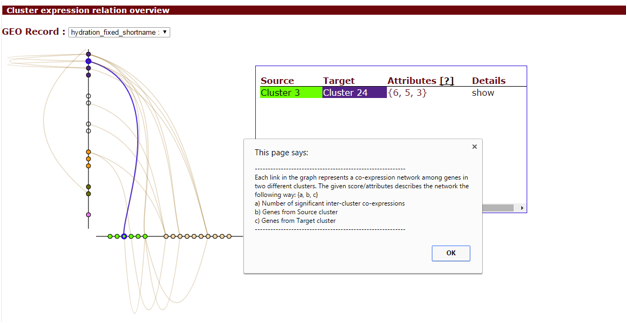
Additionally, by enabling the coexpression analysis, you will also get a Hiveplot overview of significant cluster-cluster interactions detected in the selected transcriptomics dataset. This can be accessed in the cluster overview screen.
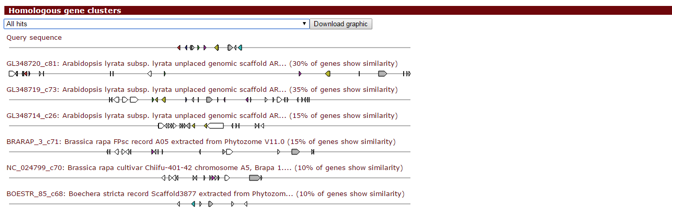
If you enabled Gene Cluster Comparative Analysis (ClusterBlast), this panel will display the top ten plant gene clusters from precomputed data that are most similar to a detected gene cluster, visually aligned to it. The drop-down selection menu can be used to browse through the gene clusters. Genes with the same colour are putative homologs based on significant Blast (Diamond) hits between them.
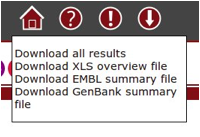
In the upper right, a small list of buttons offers further functionality. The house-shaped button will get you back to the plantiSMASH start page. The question-mark button will get you to this help page. The exclamation-mark button leads to a page explaining about plantiSMASH. The downward-pointing arrow will open a menu offering to download the complete set of results from the antiSMASH run, a summary Excel file and to the summary EMBL/GenBank output file. The EMBL/GenBank file can be viewed in a genome browser such as Artemis.
This is an example of CSV format accepted by plantiSMASH-CoExpress:
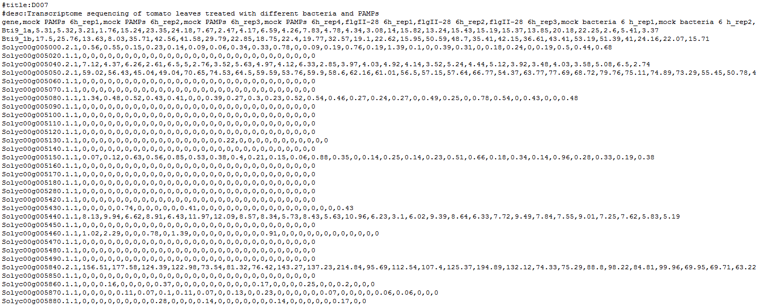
The first two lines containing #title and #desc should be self-explanatory. These are then followed by the comma separated rows. The first row would be the header, containing each sample / condition name. The next rows are for the actual expression data, with the first column containing the locus tag directly matching to the supplied genome annotation, and the next columns containing expression values of the gene for each sample /condition.
The number of columns in each row should be identical. In case of no expression data for a specific gene in a specific sample, simply put 0 or an empty character in the space between the commas. Also, one important thing to note is that the expression values should be comparable across all samples, i.e. they are measured and normalized in the same way (log values, signal count data, etc).